Collections tell stories. So does the Conserv wireless environmental monitoring system. Conserv not only watches over your collection, but it also gives you the power to organize the data it collects in ways that can be both fascinating and revealing.
Some of what you learn might not even be about the collection itself or the place where it’s stored. And yet it might be very important; more on that in a moment.
Weather data readily available
Here’s an example of a very simple data analytics story that might tell you something very significant: Conserv can show National Weather Service data on its graphs. So you could graph the temperature or relative humidity readings inside a particular space against the outdoor readings over the same period of time.
That could tell you a lot about how effective your HVAC (heating, ventilation, and air conditioning) system may be—or not be—in dealing with outside atmospheric conditions.
Compare sensors, identify correlations
Let’s expand the story a little. Conserv also makes it easy for you to compare readings for a single variable, such as relative humidity, temperature, or light, across as many different sensors as you’d like. So you could pick a variable and see how your HVAC system performs by that measure throughout your building.
Maybe everything’s great, and the story ends there, with you and your collections living happily ever after. Or maybe your HVAC system has trouble handling outside temperature or humidity extremes. Maybe different HVAC zones perform differently. Maybe some sensors even within the same HVAC zone show divergent readings.
One click to share a graph
If any irregularities do show up, then it’s time to have a talk with your facilities team to see what’s going on. Sharing your data is easy. The simplest way is to share a link. Conserv can create a URL for your graph that you can share with any colleague who has access to your account.
You can also export your data to anyone, whether a member of your team or not, as a customizable PDF that you create with one click of a button.
Giving colleagues that account access is easy, too. You email them an invitation via the Team tab. They click a link in the email and spend a few seconds signing up. Done. (You can find the Team tab under Settings, which you can access from the dropdown menu under your account name. Or just go to app.conserv.io/settings.)
Compare temp, rh, dew point
Now let’s get really in-depth. Just as you can compare readings for a single variable across multiple sensors, you can also compare multiple variables from a single sensor. (Color coding makes them easier to read.) Why would you want to look at multiple variables?
Just try placing the holy trinity of environmental levels—relative humidity, temperature, and dew point—all on a single graph. You may be surprised at the complexity of the story that their interplay tells you.
Or you might graph general light levels along with ultraviolet levels. Of course, you need some light in order to use the collection (unless you’re storing it in the dark). But you want as little UV light as possible. You may learn that it’s time for a UV treatment on the window nearest the sensor.
Preservation KPIs
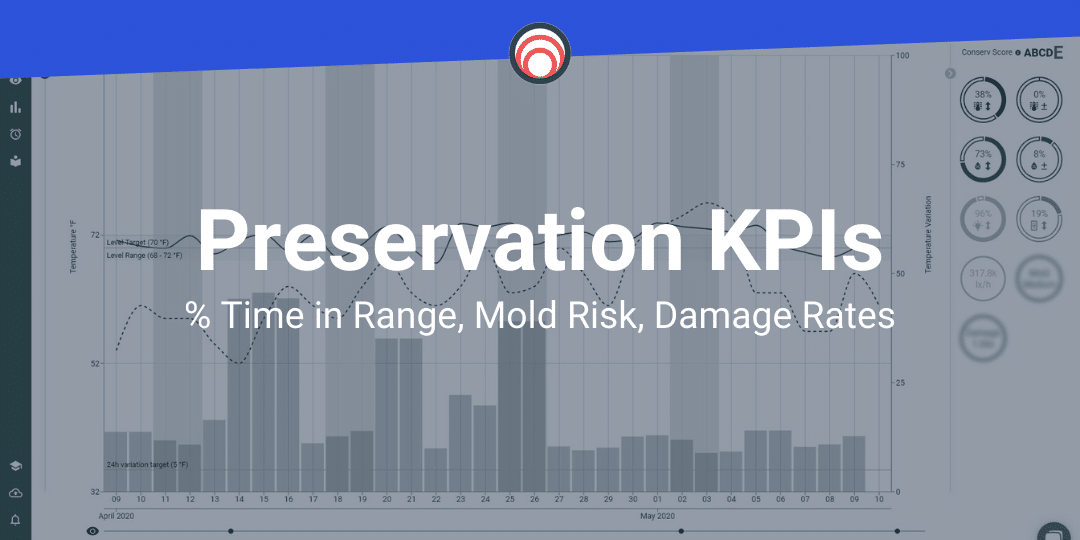
Finally, how about metrics that help you tell your environment story to the rest of the collections team, your facilities colleagues, or the board? Simple numbers like “what % of the time was I within my temperature range?” or the Conserv Score – a simple letter grade from A to E – can transform a complex temp/RH chart into a single easily digestible number.
Preservation KPIs are what separate Conserv from the other sensor businesses that are only providing line charts. Collections professionals, now you can access a series of metrics designed specifically for you.
Our CEO and resident data guru Austin Senseman breaks down our Preservation KPIs.
Discover new insights
You also may stumble across a mystery that’s not even specifically about the collection itself or its environmental controls. Why are the lights on at night when they’re supposed to shut off automatically? Why do the lights never come on in a storage space that someone is supposed to be checking regularly? It could be time for a little detective work.
Analytics can tell many stories besides the ones we’ve listed here. Learn more about the possibilities by clicking or tapping the Analytics tab in the Conserv Cloud section of our Help Center.
All new analytics experience
We recently upgraded the analytics experience based on feedback from the collections community. Thanks very much to everyone who helped. If you have an idea for improving an existing feature or adding an entirely new feature, please let us know.
If you have any questions about environmental monitoring, integrated pest management, or just want to talk about preventative conservation, please reach out to us! Don’t forget to check out our blog or join our community of collections care professionals where you can discuss hot topics, connect with other conservators or even take a course to get familiar with the Conserv platform.


